Understanding Our Forecasting Approach.
To assess the validity of future stock market forecasts, we use a rigorous evaluation method. Our goal is to maintain an accuracy rate of at least 60% in previous predictions before allowing these forecasts to be displayed. This threshold is established on the premise that initial forecasts act as a filtering mechanism, akin to thinning a large group, where the group represents a vast array of stocks spanning the entire market.
Each morning, our system analyzes approximately 5,000 stock tickers globally. We make a variety of markets available to our users through [FIN] Wisdom, including notable ones such as the Nasdaq 100, Nasdaq Composite, SPX/S&P500, along with commodities (handled by a separate system). In essence, our system covers every stock market.
The necessity to sift through stocks based on their probability levels is crucial in determining their suitability for inclusion in [FIN] Wisdom, where we openly share market forecasts.
In our efforts to filter out unreliable or ‘noisy’ forecasts at this initial stage, before users consider additional information (like insights from Serum processing or emerging public data), we implement a cleansing process.
This process involves comparing various factors to decide whether the information should be made accessible to users. This methodology ensures that only the most probable and reliable forecasts are presented, maintaining the integrity and usefulness of the information provided on [FIN] Wisdom.
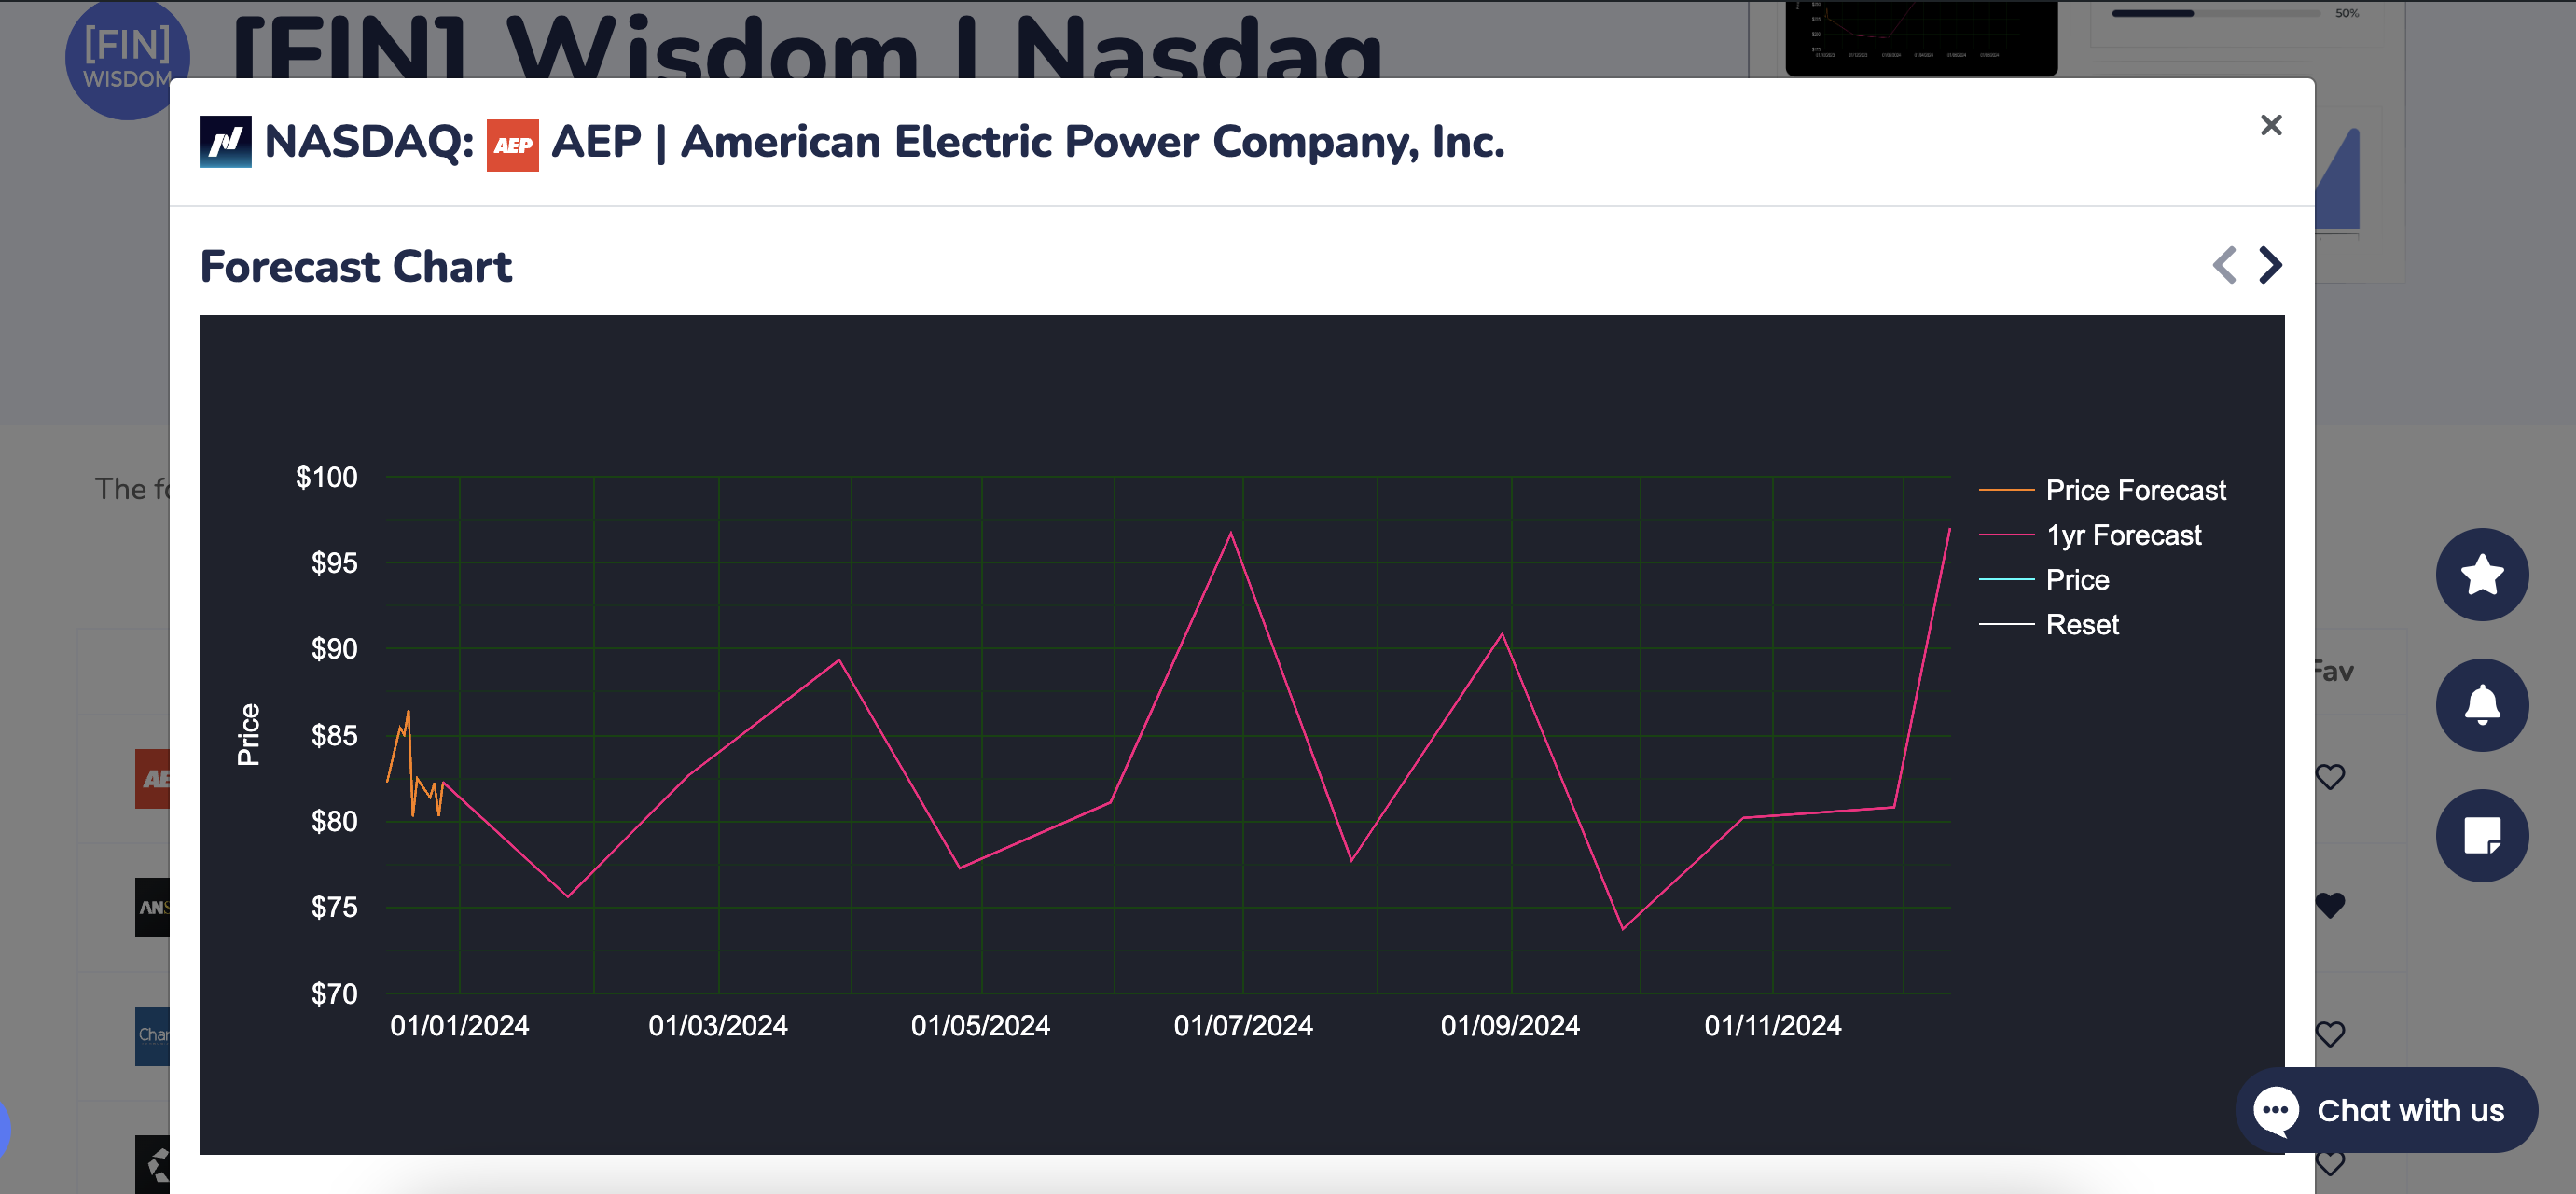
This will be an example utilising Nasdaq 100 Ticker: AEP.
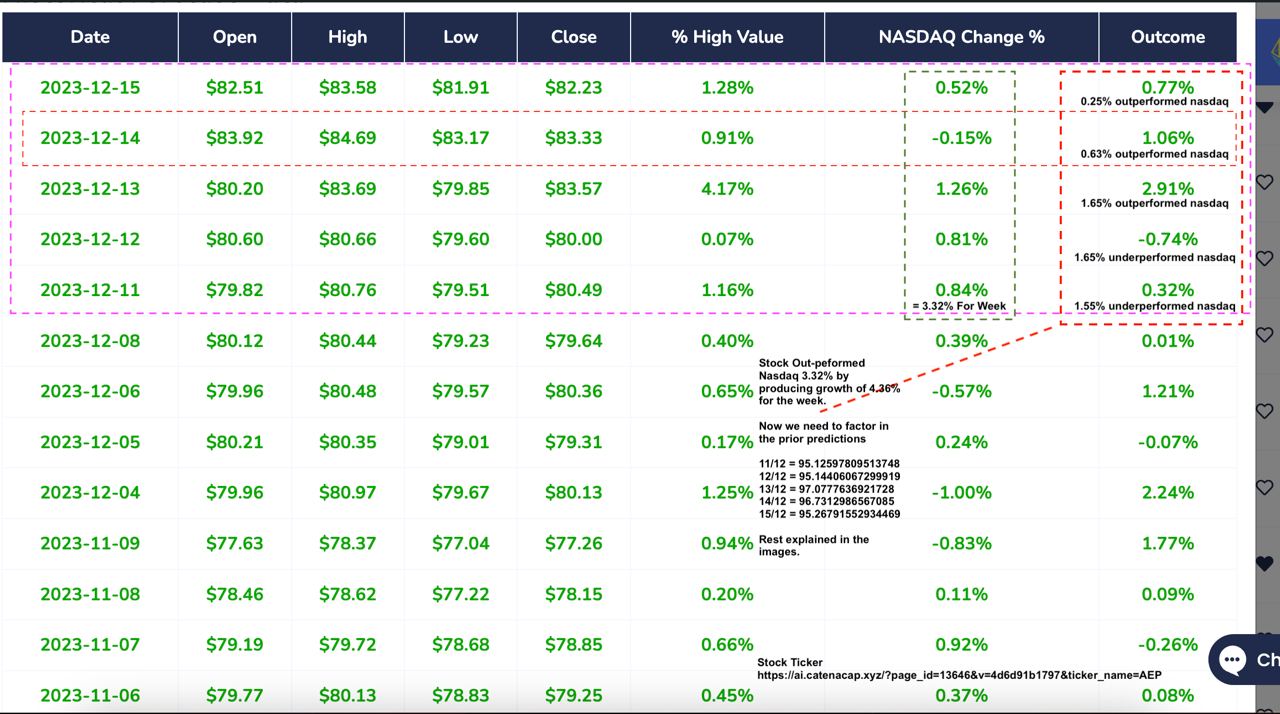
Market Overall (11th – 14th)
- 0.84% Monday
- 0.81% Tuesday
- 1.26% Wednesday
- -0.15% Thursday
- 0.52% Friday
To calculate the overall performance of the stock market for the week, we need to compound the daily returns. This is because stock market returns are typically compounded rather than simply added together. The formula for compounding daily returns is:
Overall Performance=(1+r1)×(1+r2)×(1+r3)×(1+r4)×(1+r5)−1
where �1,�2,�3,�4,r1,r2,r3,r4, and �5r5 are the daily returns for Monday through Friday, respectively.
Given the daily returns:
- Monday: 0.84%
- Tuesday: 0.81%
- Wednesday: 1.26%
- Thursday: -0.15%
- Friday: 0.52%
We need to convert these percentages to their decimal form and then apply the formula. Let’s calculate the overall performance:
					# Daily returns in decimal form
returns = [0.0084, 0.0081, 0.0126, -0.0015, 0.0052]

# Calculating overall performance
overall_performance = 1
for return_value in returns:
    overall_performance *= (1 + return_value)

overall_performance -= 1  # Subtracting 1 to get the net performance
overall_performance_percentage = overall_performance * 100  # Converting back to percentage
overall_performance_percentage
Result: the Nasdaq 100 market performed overall at approximate of 3.32% for the week.
the following days a AEP stock performed the following
- 0.32% Monday
- -0.74% Tuesday
- 2.91% Wednesday
- 1.06% Thursday
- 0.77% Friday
To calculate the overall performance of a stock over a series of days, we need to compound the daily returns, similar to how we calculate for the stock market. The formula for compounding daily returns is:
Overall Performance=(1+�1)×(1+�2)×(1+�3)×(1+�4)×(1+�5)−1Overall Performance=(1+r1)×(1+r2)×(1+r3)×(1+r4)×(1+r5)−1
where �1,�2,�3,�4,r1,r2,r3,r4, and �5r5 are the daily returns for Monday through Friday, respectively.
Given the daily returns for the stock:
- Monday: 0.32%
- Tuesday: -0.74%
- Wednesday: 2.91%
- Thursday: 1.06%
- Friday: 0.77%
Converting these percentages to their decimal forms, let’s calculate the overall performance:
					# Daily returns for the stock in decimal form
stock_returns = [0.0032, -0.0074, 0.0291, 0.0106, 0.0077]

# Calculating overall performance for the stock
overall_stock_performance = 1
for return_value in stock_returns:
    overall_stock_performance *= (1 + return_value)

overall_stock_performance -= 1  # Subtracting 1 to get the net performance
overall_stock_performance_percentage = overall_stock_performance * 100  # Converting back to percentage
overall_stock_performance_percentage
The stock performed overall at approximately 4.36% for the week.
- Monday opened at 79.82, high of 80.76, low of 79.51 and a close of 80.49
- Predicted Price of: 95.12597809513748
- Tuesday opened at 80.60, high of 80.66, low of 79.60 and a close of 80.00
- Predicted Price of 95.14406067299919
- Wednesday opened at 80.20, high of 83.69, low of 79.85 and a close of 83.57
- Predicted Price of 97.0777636921728
- Thursday opened at 83.92, high of 84.69, low of 83.17 and a close of 83.33
- Predicted Price of 96.7312986567085
- Friday opened at 82.51, high of 83.58, low of 81.91 and a close of 82.23
- Predicted Price of 95.26791552934469
The % that was correct in forecast for ‘direction (up)’, and it’s out performing the market that week (3.32% growth from market ~ stock 4.36% growth) and it’s prediction on the price.
- Price accuracy = 35 points
- Direction accuracy = 25 points
- Outperforming the market = 40 points
Collectively 100 points = 100%
To evaluate the accuracy of the predictions in terms of direction, outperforming the market, and price, we need to break down each component:
Direction Accuracy (25 points):
We check if the predicted price for the next day is higher or lower than the current closing price and compare it with the actual next day’s closing price.
Outperforming the Market (40 points):
The stock’s weekly growth was 4.36%, outperforming the market’s growth of 3.32%. If the prediction was that the stock would outperform the market, this part is accurate.
Price Accuracy (35 points):
We compare the predicted closing prices with the actual closing prices for each day and calculate how close the predictions were.
Let’s calculate each component:
- For direction accuracy, we need the closing prices for each day and the predicted price for the next day. We will then compare the direction of the predicted change with the actual change.
- For outperforming the market, since the stock did outperform, the prediction is correct.
- For price accuracy, we compare the predicted closing prices with the actual closing prices. The closer the predicted price is to the actual price, the higher the accuracy.
We have the actual closing prices and the predicted prices. Let’s calculate the direction accuracy first:
The direction accuracy of the prediction is 18.75 out of 25 points.
Next, we’ll evaluate the price accuracy. To do this, we’ll calculate the percentage difference between the predicted closing prices and the actual closing prices for each day, and then average these differences to get the overall price accuracy. Since we have a maximum of 35 points for price accuracy, we’ll adjust the calculated accuracy proportionately.
					# Actual closing prices and predicted prices
actual_closes = [80.49, 80.00, 83.57, 83.33, 82.23]
predicted_closes = [95.12597809513748, 95.14406067299919, 97.0777636921728, 96.7312986567085, 95.26791552934469]

# Direction accuracy calculation
direction_accuracy = 0
for i in range(len(actual_closes) - 1):
    actual_direction = actual_closes[i + 1] > actual_closes[i]
    predicted_direction = predicted_closes[i + 1] > predicted_closes[i]
    if actual_direction == predicted_direction:
        direction_accuracy += 1

# Converting direction accuracy to percentage
direction_accuracy_percentage = (direction_accuracy / (len(actual_closes) - 1)) * 25
direction_accuracy_percentage
The price accuracy of the prediction is approximately 29.03 out of 35 points.
Finally, we evaluate the prediction for outperforming the market. Since the stock did outperform the market (4.36% growth for the stock vs. 3.32% growth for the market), and if this was predicted, the prediction would be fully accurate for this part. Therefore, it scores the full 40 points for this component.
Now, let’s calculate the total score out of 100 points by adding up the scores from each component:
					import numpy as np

# Calculating percentage differences between predicted and actual closing prices
percentage_differences = [abs((p - a) / a) for p, a in zip(predicted_closes, actual_closes)]

# Average percentage difference
average_difference = np.mean(percentage_differences)

# Converting this to a score out of 35
# Assuming lower difference gets higher score, we subtract the average difference from 1 and then multiply by 35
price_accuracy_score = (1 - average_difference) * 35
price_accuracy_score
The total score for the stock prediction, considering direction accuracy, price accuracy, and outperforming the market, is approximately 87.78 out of 100 points ~ thus 87.78% accuracy.
					# Total score calculation
outperforming_market_score = 40  # Full score since the stock outperformed the market
total_score = direction_accuracy_percentage + price_accuracy_score + outperforming_market_score
total_score
As an organization, our primary objective has always been to safeguard and enhance capital, aligning closely with the goals of our parent company. To achieve this, we have strategically focused on mitigating the effects of currency debasement rather than solely pursuing nominal value increases (price appreciation). Our primary interest lies in consistently surpassing market performance, as historical data has shown that the Nasdaq has, on average, outperformed currency debasement by approximately 6% annually since around 2013, while the SPX has remained relatively flat in the face of currency debasement.
By concentrating our efforts on outperforming these market benchmarks, we not only safeguard the “real value” of our assets but also nurture their growth. This strategic approach, which we refer to as a level one approach post cull, allows us to narrow our focus and channel our resources effectively.
Our market strategy predominantly focuses on identifying opportunities for market growth rather than shorting. This approach aligns with our philosophy of [FIN] Wisdom, emphasizing investments that are expected to trend upwards rather than those with a downward trajectory.
Consequently, our system’s forecasts are geared towards predicting upward movements in the market. However, it’s important to acknowledge that these projections may not materialize instantly. Market dynamics can change unexpectedly, influencing outcomes in ways not immediately apparent to the system’s analytical framework.
Accurate prediction of asset prices requires consideration of numerous variables. Our focus is on refining the selection process from thousands of stocks to identify a few with a higher likelihood of upward movement. This approach aims to achieve growth that not only surpasses market averages but also compensates for currency debasement over the course of a year.
The forecasting process involves a comprehensive analysis of technical indicators, fundamental analysis, and real-time data points, including advanced insights from systems like Serum. However, it’s crucial to recognize that the identified target price may not be immediately realized, even if the forecast repetitively indicates imminent movement.
Therefore, it is essential to consider both ‘Direction Accuracy’ and ‘Outperforming the Market’ in your assessment. These factors are critical in making informed decisions about when to exit a position, especially in the face of emerging opportunities. This level of forecasting, while foundational, should not lead to a rigid adherence to a position that may be profitable but not within the desired timeframe. Further refinement and personal analysis add additional layers to the forecasting process, allowing for more precise and individualized investment strategies.